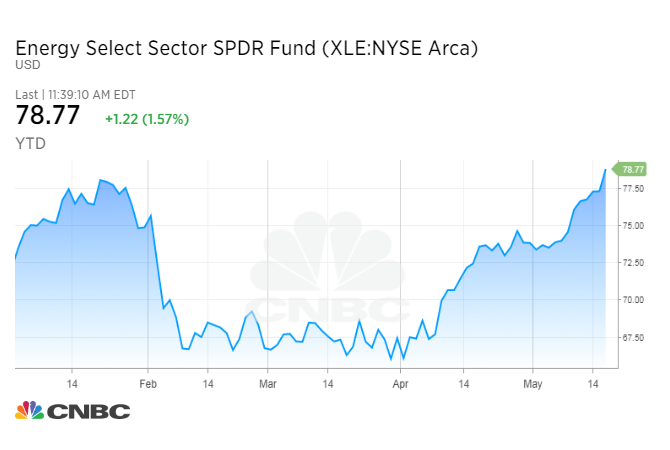
A closely-followed basket of energy stocks hit a nearly 3-year high on Thursday and could keep rising despite long-term market trends.
The Energy Select Sector SPDR exchange-traded fund — better known by its ticker symbol XLE — rose as high as $78.83 on Wednesday. At that level, its trading at its highest since June 3, 2015, when it topped out at $79.07.

Energy stocks are finally breaking out for several reasons, but the run-up in oil prices is supporting the sector in the near-term. Brent crude oil on Thursday broke above $80 a barrel for the first time since November 2014, fueled by geopolitical uncertainty after the Trump administration restored sanctions on major crude exporter Iran.
The XLE has now crossed two significant thresholds, according to Roberto Friedlander, head of energy trading at Seaport Global Securities.
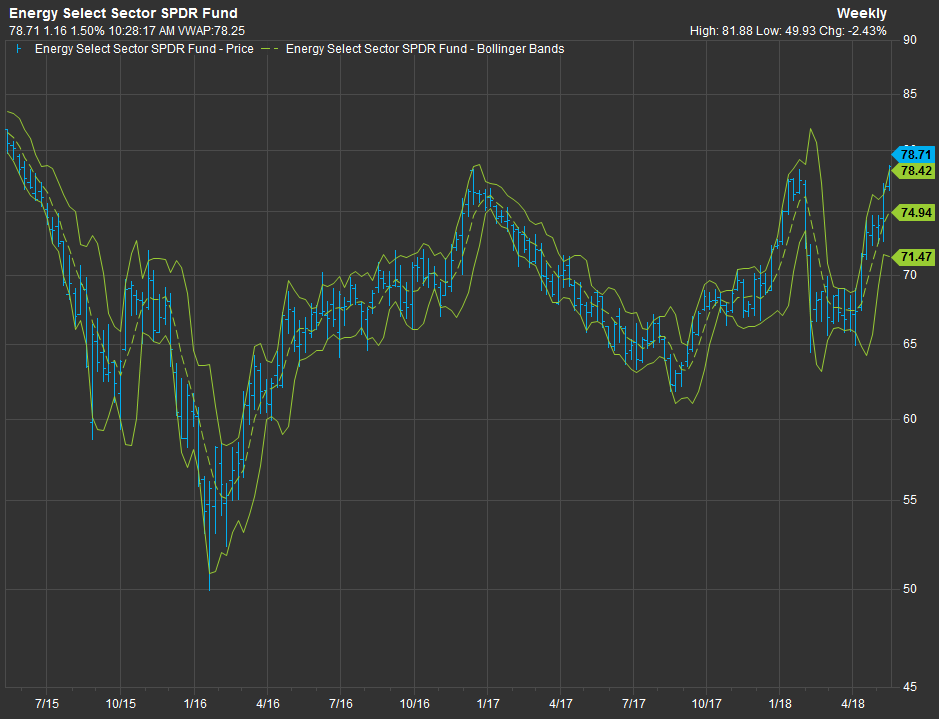
First, the XLE topped January’s high of $78.39 at the same time that Brent and U.S. crude are hitting 3½-year highs. Second, the fund is breaking above the upper Bollinger Band. The so-called Bollinger Bands represent a range that indicates when prices for an asset are either looking expensive or have potentially become undervalued.
XLE fund with Bollinger Bands

Source: FactSet
Rising above the upper Bollinger band often sets up a sell-off that knocks the asset price back within the range. However, it’s possible that history will not be a guide in today’s market because investors are still not holding a lot of energy stocks, according to Friedlander.
“There are a lot of longer-term money managers still underweight energy as a whole,” he said. “I think this could keep going for a while.”
The XLE is now on pace for its 10th straight day of gains, a feat it has not accomplished since it notched a 10-day winning streak on July 2006. The fund is also on pace for its sixth straight week of gains, its longest week-to-week stretch since September.
— CNBC’s Chris Hayes contributed to this story.
Source: Investment Cnbc
Energy stocks just broke through a key level and could keep rising, according to the charts