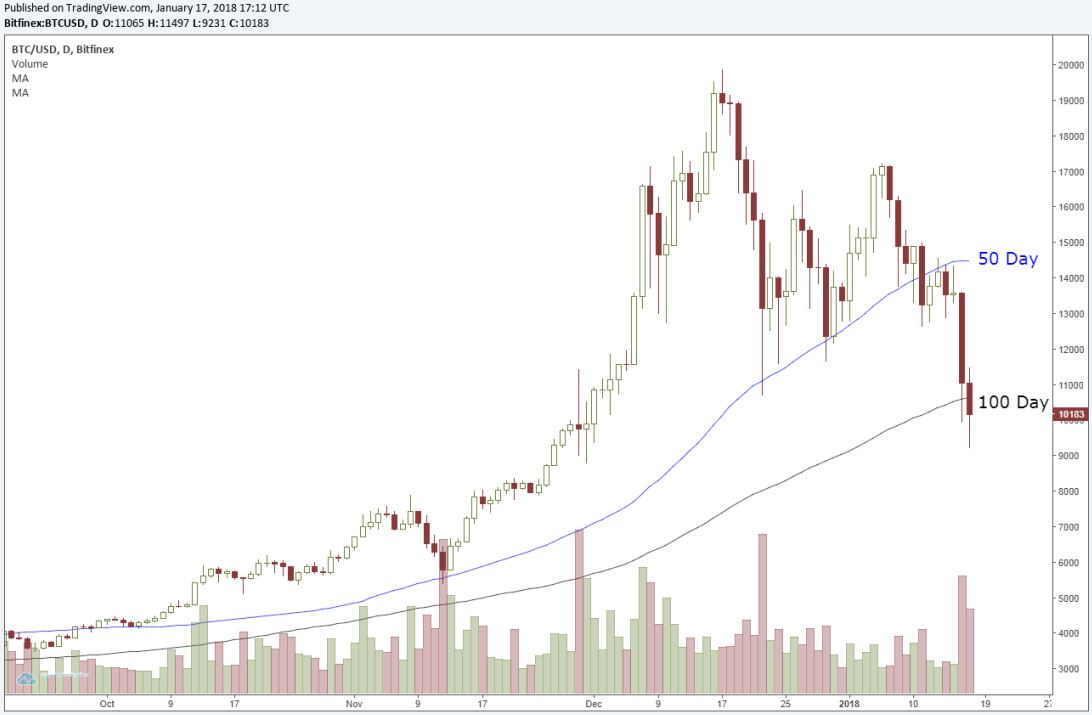
While bitcoin may look like it will continue to crash and burn, its chart suggests it could be trying to find at least a temporary price floor.
Technical analysts say it’s way too soon to say whether the price of the cryptocurrency is bottoming, after its stunning collapse, but they are watching the 100-day moving average on the bitcoin chart.
Bitcoin prices, and therefore charts, vary, but the technicians put the 100-day moving average right around $10,000. Bitcoin fell through that level on Wednesday. Other data puts the 100-day closer to $9,000. According to CNBC.com’s chart, Bitcoin hit a low Wednesday of $9,230, less than half its all-time high reached in December. It was just above $10,000 in afternoon trading, down about 13.5 percent.
“It held the 100-day, which it hasn’t been below in over two years,” said T3Live.com partner Scott Redler, who follows short term technicals.
“Bitcoin is testing an important level….Bitcoin is searching for a spot to find support. It seems to have found it at the 100-day which it has for the past two years or so. The question is what type of bounce,” he said. “Now the 50 day which has been support for the past year could now pose as resistance.”
The 50-day moving average is just around $14,500, according to Redler’s chart. Redler uses Tradeview data.
“So if the bounce is ‘feeble’ off the 100-day, the 200-day is usually the likely spot. We’ll see if the 50-day that was support for the past year turns into resistance,” he said. The 200-day moving average is around $7,100.
Redler said bitcoin’s chart had flashed a major warning.
“I was very cautious on it when it broke $17,000 because it broke the momentum trend ,” he said, adding it is looking to be at a more constructive level now.

Source: T3Live.com
Bitcoin tests important price level after dramatic plunge